As industrial systems scale, dashboard performance becomes critical. Poorly optimized web dashboards can cause delays, incorrect decisions, and operator frustration. Proper optimization ensures reliable real-time monitoring.
1. Why Dashboard Performance Matters
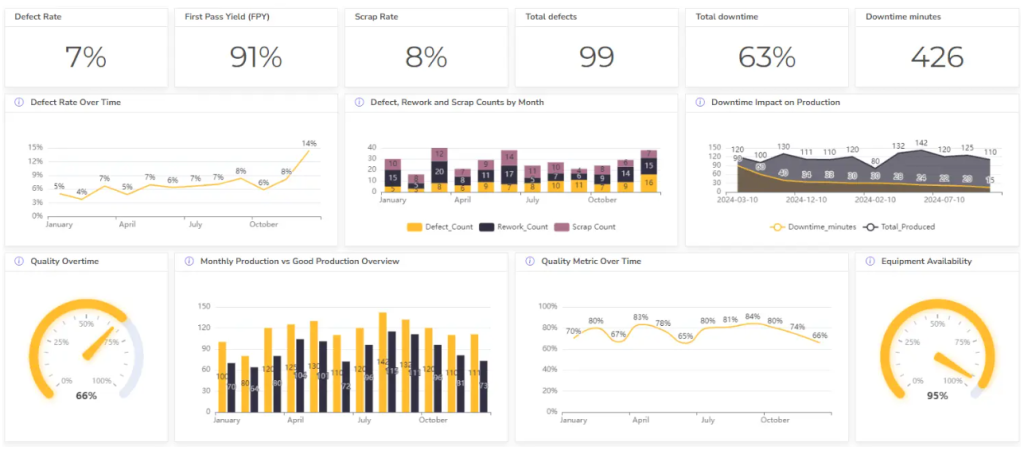
Industrial dashboards display:
- High-frequency sensor data
- Multiple machines and sites
- Historical trends and alarms
Slow dashboards reduce situational awareness and response speed.
2. Common Performance Bottlenecks
- Excessive real-time polling
- Rendering too many widgets at once
- Unoptimized database queries
- Large data payloads
Identifying these issues is the first step to optimization.
3. Best Practices for Industrial Web Dashboards
- Use data aggregation: Display averages instead of raw data
- Limit refresh rates: 1–2 seconds is sufficient for most use cases
- Lazy loading: Load charts only when needed
- Efficient queries: Use time-range filters and indexed timestamps
- Caching: Cache static or slow-changing data
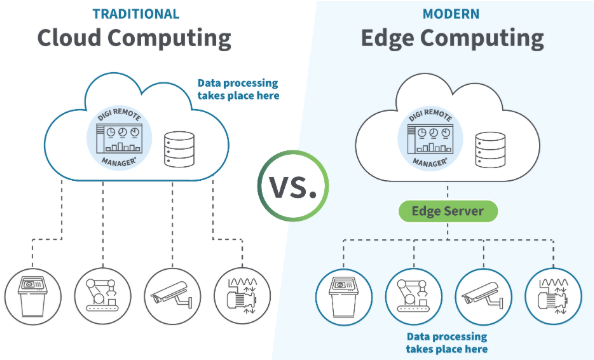
4. Edge Computing for Better Performance
Edge devices can:
- Preprocess and filter data
- Trigger alarms locally
- Reduce network and cloud load
This improves dashboard responsiveness and reliability.
5. Benefits of Optimized Dashboards
- Faster load times
- Clearer data visualization
- Reduced server and network costs
- Better operator decision-making
Optimized web dashboards ensure industrial data remains actionable at scale.