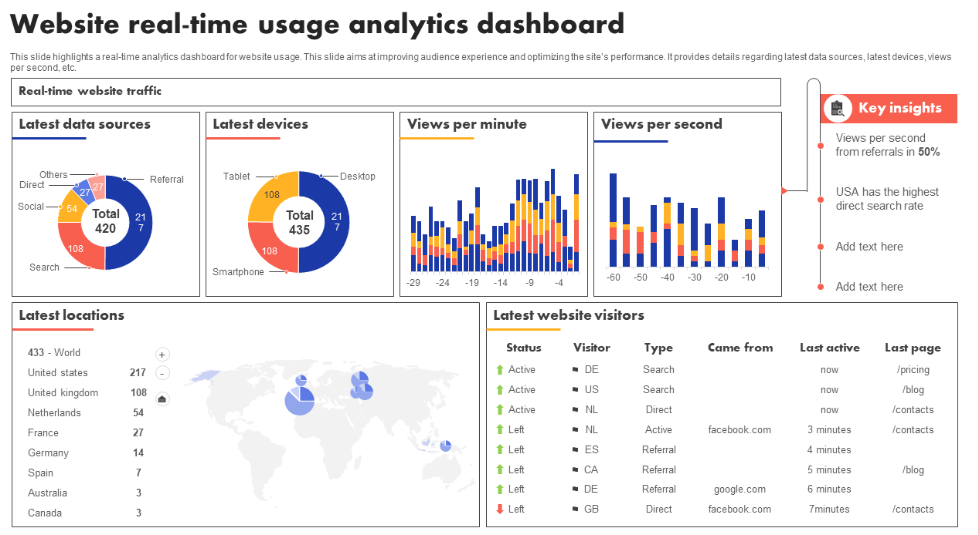
A real-time dashboard is one of the most powerful tools in industrial data acquisition. It transforms raw machine data into clear visual insights, helping engineers and managers make decisions faster.
1. What Is a Real-Time Dashboard?
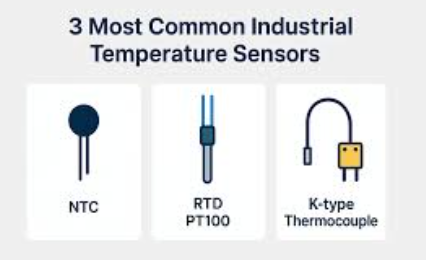
A real-time dashboard displays live data from:
- Sensors
- PLCs
- Meters
- Industrial equipment
The information is updated automatically, often every second or faster.
2. Key Benefits for Industrial Operations
1. Instant Visibility
Engineers can see:
- Temperature spikes
- Pressure changes
- Machine running status
- Energy usage trends
All without logging into multiple systems.
2. Faster Troubleshooting
When a fault occurs:
- Alarms trigger immediately
- Values highlight in red
- Operators know exactly which machine is affected
This reduces downtime and prevents process interruptions.
3. Better Data-Driven Decisions
Dashboards help teams:
- Analyze productivity
- Track equipment health
- Identify inefficiencies
- Compare performance across shifts or sites
Visual data improves operational planning and resource allocation.
4. Remote Access from Any Device
Modern dashboards work on:
- Web browsers
- Tablets
- Mobile phones
Managers can monitor factory status from anywhere.
3. Important Dashboard Features
A good industrial dashboard should support:
- Custom widgets (gauges, charts, tables)
- Real-time alerts
- User access control
- Historical data playback
- Multi-device responsiveness
These features ensure reliable monitoring across all industrial environments.
4. Common Use Cases
- Factory production lines
- Utility monitoring (water, gas, electricity)
- Energy management
- Condition monitoring
- Machine availability (OEE)
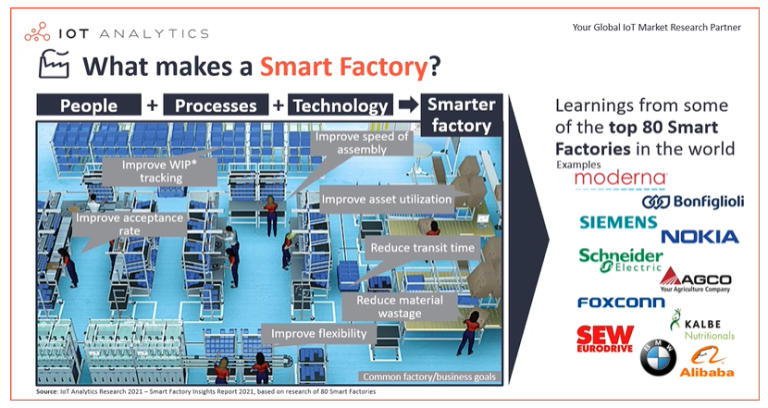
Real-time dashboards are now a standard requirement for smart factories.